Quite a few people agree
Quite a few people agree that John Green looks like me.
A few days ago, I published this post on my blog. I posted links to my article on Facebook and on Reddit. Much to my surprise and much to my excitement, people from all over the world read my writing.
Thanks to the magic of Google Analytics, I know how many people viewed my site. This data is from September 24th - September 26th.

Twenty five hundred different people. Nearly four thousand total page views. Wow.
The following is a graph of visits per hour.
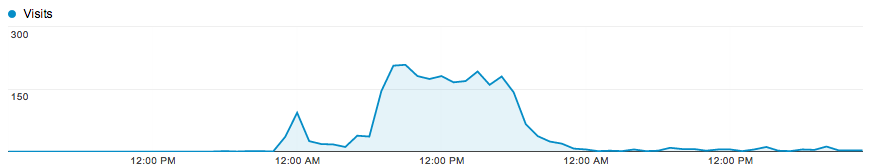
The first spike in the graph is from Facebook. The mountain you see is from Reddit.
How many people total came from Facebook and Reddit?

That’s interesting. Somebody else posted the link to my blog on Tumblr. That’s pretty cool.
So now we know how they found out about my blog post, but how did people view it?
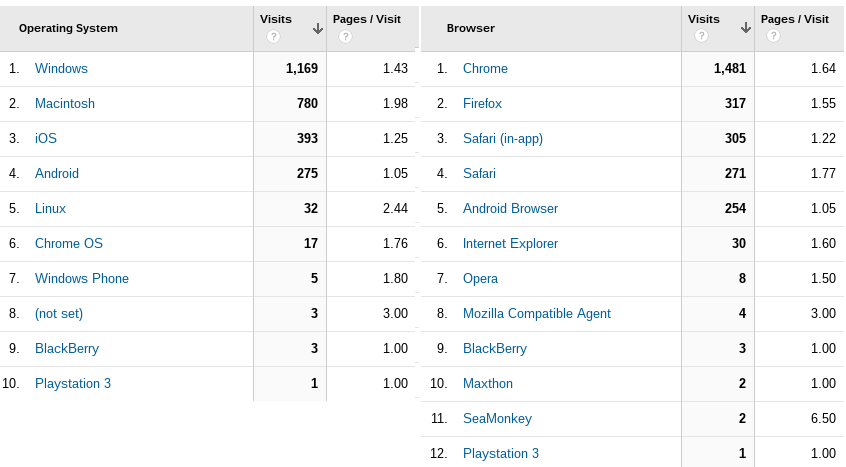
Not surprisingly, most people viewed my blog with Windows. Out of all of the operating system users, Linux’s viewed the most different pages on average.
Thankfully, only 30 readers used Internet Explorer (although that number is still too high). Chrome was the most popular browser. SeaMonkey users viewed the most different pages per user. Guess what browser my mother uses.
I’ve saved my favorite graph for last. In which countries do my readers live?
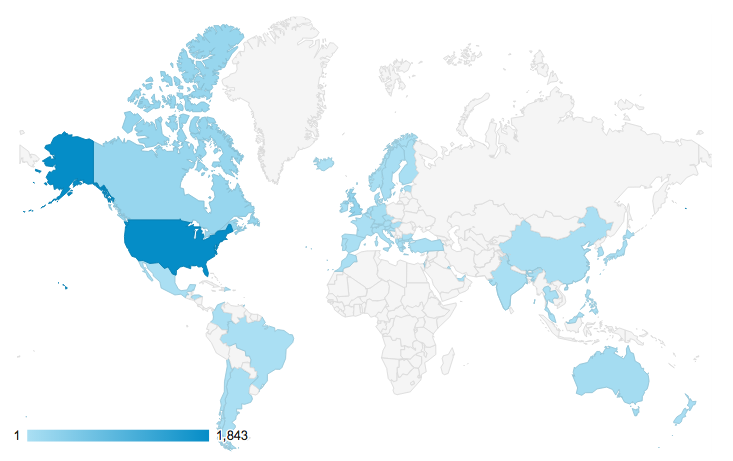
People from Africa, Asia, Australia, Europe, North America, and South America have read my blog post. People from more than 50 countries have viewed my site. By golly, that’s quite a few.
comments powered by Disqus